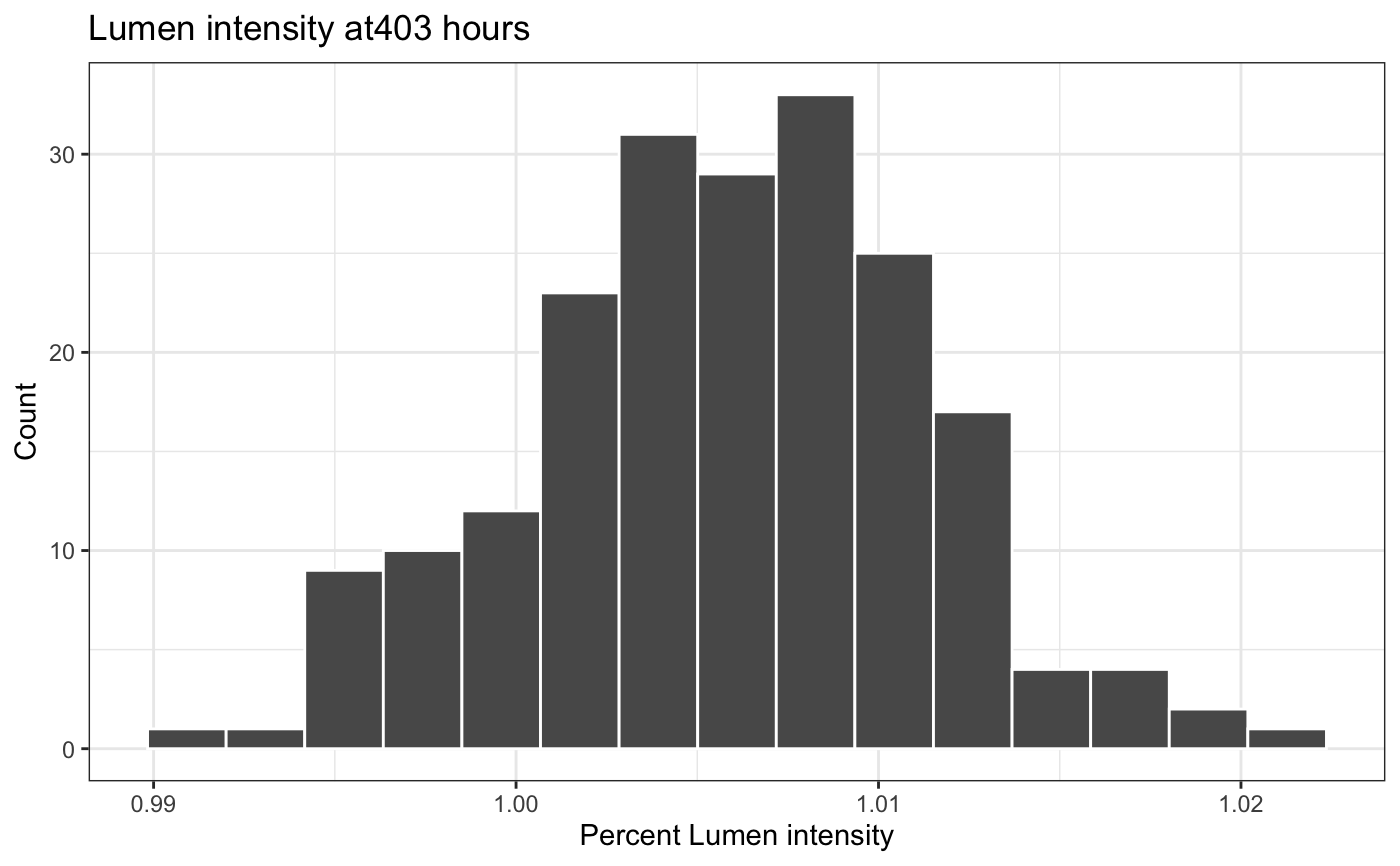
Create a histogram for bulb values.
led_histogram.RdPlot a ggplot2 histogram.
led_histogram(led_data, use_intensity = FALSE, nbins = 15)
Arguments
| led_data | is a data object from the function led_bulb(). |
|---|---|
| use_intensity | defines whether inensity or percent intensity is plotted on the y-axis. |
| nbins | the number of bins to use in the histogram |