Create a time-series chart of LED bulbs.
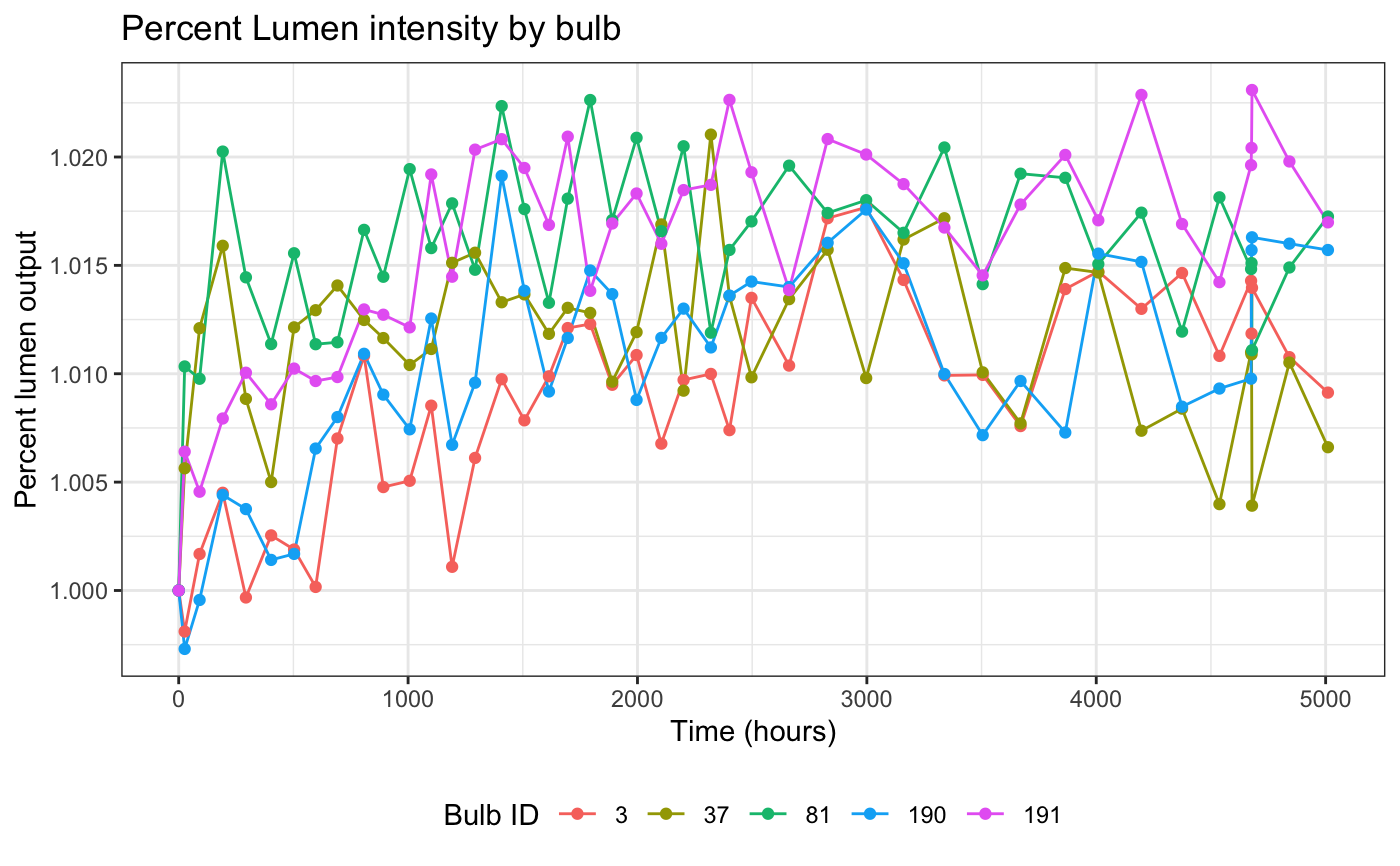
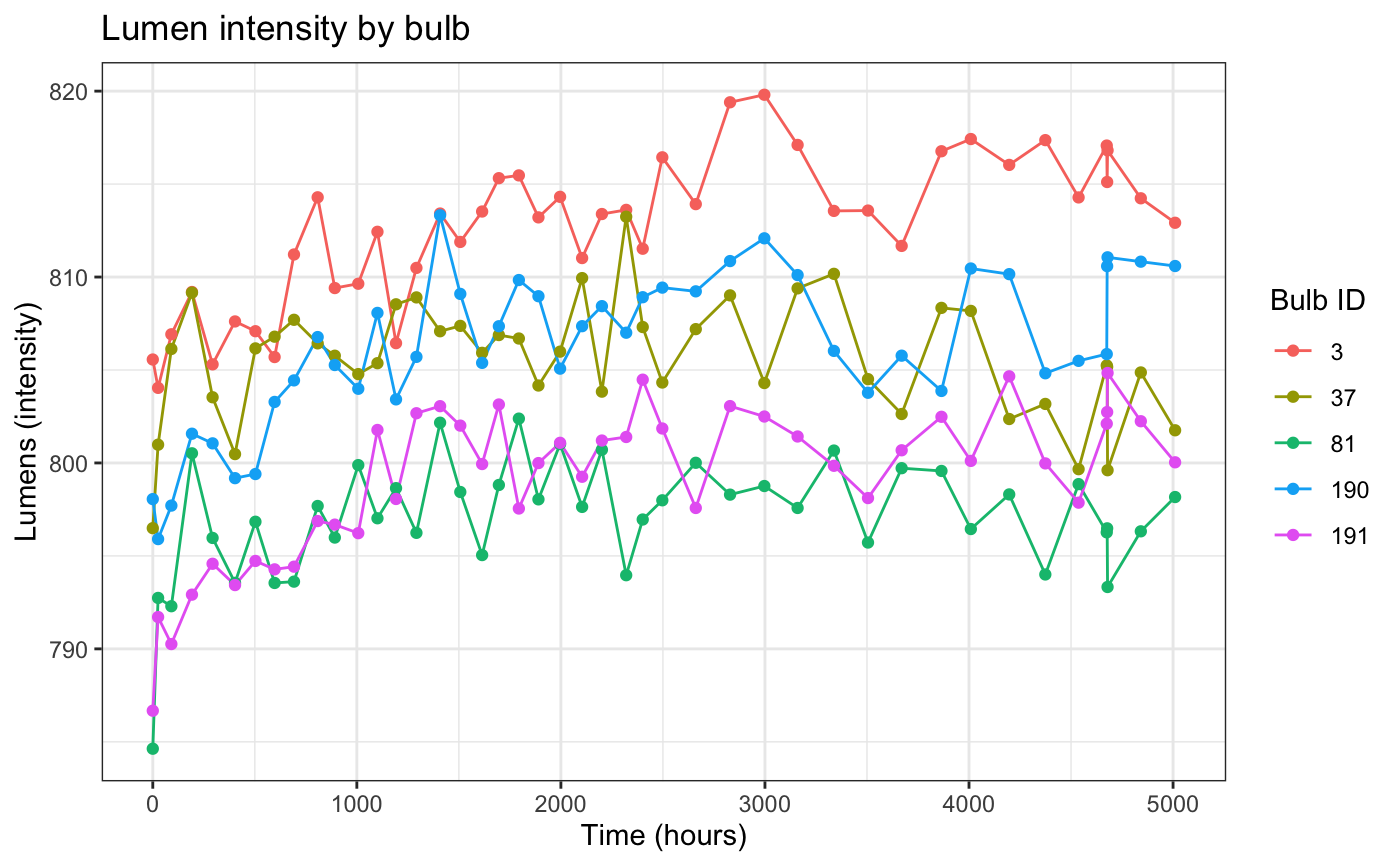
led_linechart.RdPlot a ggplot2 linechart colored by bulb.
led_linechart(led_data, use_intensity = FALSE)
Arguments
| led_data | is a data object from the function led_bulb(). |
|---|---|
| use_intensity | defines whether inensity or percent intensity is plotted on the y-axis. |